* Reducing Housing Options for Convicted |
|
Sex Offenders: Investigating the Impact of |
|
Residency Restriction Laws Using GIS |
|
Paul A. Zandbergen
Department of Geography
University of South Florida
Timothy C. Hart
Department of Criminal Justice
University of Nevada, Las Vegas
* Abstract
Sex offender registries have been established throughout the United States. To date, 16 states have adopted additional residency restriction policies, precluding registered sex offenders from living within a certain distance of places where children gather. This study quantifies the impact of residency restrictions on housing options for registered sex offenders using Orange County, Florida, as a case study. A Geographic Information System (GIS) is employed to identify all occupied residential properties using parcel-level zoning data as well as those that fall within the 1,000-foot restricted buffer zones around attractions, bus stops, daycares, parks, and schools. Results indicate that housing options for registered sex offenders within urban residential areas are limited to only 5% of potentially available parcels and that bus stop restrictions impact the amount of livable area the most, followed by daycares, schools, parks, and attractions. The limited options to establish residency exist mostly in low-density rural areas. This supports the argument that residency restrictions for sexual offenders are a strong contributing factor to their social and economic isolation. The impacts of increasing the buffer to a proposed 2,500-foot zone are discussed, and a comparison of the individual restriction categories is presented.
JUSTICE RESEARCH AND POLICY, Vol. 8, No. 2, 2006 © 2006 Justice Research and Statistics Association
2 • Justice Research and Policy
* Introduction
In an effort to protect the public—especially children—from sexual offenders, federal, state, and local policymakers have crafted crucial legislation aimed at addressing this important social problem. The Jacob Wetterling Act (1994), for example, compels states to establish sex offender registries, which are de- signed to help track and monitor convicted offenders more efficiently and ef- fectively. Megan’s Law (1996) and the PROTECT Act (2003) promote commu- nity awareness and safety by requiring law enforcement agencies to notify the public about where registered sex offenders live. And the Adam Walsh Child Protection and Safety Act (2006) expands the power of sex offender registries by integrating data from registries across the United States into the National Sex Offender Registry. Policymakers have also passed residency restriction legislation that precludes sex offenders from living within certain distances of places where children gather in hopes of decreasing the likelihood that they will become victims of future sex crimes (see Florida Statute §947.1405(7a)(2); see also Iowa Code §692A.2A; see also Township of Manalapan, NJ: Chapter §187-1). Lawmakers had little more than public support to guide them when some of these laws were initially crafted, and a growing body of evidence ques- tions their efficacy (e.g., Wright, 2003).
Several recent studies have demonstrated that sex offender registration and notification laws may produce unintended outcomes,1 including an in- creased likelihood of reoffending (Edwards & Hensley, 2001; Elbogen, Patry, & Scalora, 2003; Hanson & Harris, 1998; Tewksbury, 2005), public anxiety, retaliation, harassment, stigmatization, and retribution (Edwards & Hensley, 2001; Levenson & Cotter, 2005a; Schram & Milloy, 1995; Tewksbury, 2004; Tewksbury & Lees, 2006; Younglove & Vitello, 2003; Zevitz, Crim, & Farkas, 2000),problemsassociatedwithoffenderdisplacementandreentry(Blair,2004; Edwards & Hensley, 2001; Elbogen et al., 2003; Levenson & Cotter, 2005a; Tewksbury, 2005; Zevitz et al., 2000), obtaining and maintaining employment (Tewksbury, 2004; Tewksbury & Lees, 2006), difficulties in personal and so- cial relationships (Tewksbury, 2004; Tewksbury & Lees, 2006), and limiting housing options (Mustaine, Tewksbury, & Stengel, 2006a; 2006b; Tewksbury, 2004; Zevitz & Farkas, 2000). In short, contemporary sex offender registration and notification laws may do more harm than good.2 Though the consequences
1 See Welchans (2005) for a review of empirical evaluations of sex offender registra- tion and community notification policies.
2 Although none of the aforementioned studies measure the degree to which reof- fending occurs, each provides insight into the adverse effects that notification and resi- dency restriction policies have on sex offenders and which may subsequently result in an increased likelihood of reoffending.
Housing Options for Sex Offenders • 3
of these laws are becoming increasingly apparent, less is known about polices designed to place limits on where sex offenders can live.
Recently both the Colorado Department of Public Safety and the Minnesota Department of Corrections investigated the relationship between reoffending and the geographic proximity of sex offenders to places where children gather. Results of the two studies challenge some of the underlying assumptions of residency restriction laws. The study in Colorado, for example, revealed that child molesters who reoffended do not live closer to schools or daycare cen- ters than non-recidivists (Colorado Department of Public Safety, 2004)3, and the Minnesota study concluded that proximity to parks and schools is not a factor contributing to recidivism; as a result, the Department recommended that blanket proximity restrictions should not be implemented (Minnesota Department of Corrections, 2003). Yet findings from these studies are at odds with those produced from a study of child molesters living in Arkan- sas, which found that a significantly greater percentage of them lived closer to schools, daycare centers, and parks than did sex offenders whose crimes were committed against adults (Walker, Golden, & VanHouten, 2001); and more recently, with findings produced from a study conducted in Seminole County, Florida, which demonstrated a moderate association between places where children frequently congregate and places where sex offenders reside (Tewksbury & Mustaine, 2006). In light of these findings, debate continues over whether residency restriction laws reduce future violence (Association for the Treatment of Sexual Abusers, 2005). Nevertheless, investigations into the unintended consequences produced by policies that limit where sex offenders can live are beginning to emerge. Due to its restrictive nature, legal experts are carefully monitoring Iowa’s residency restriction law. Two cases worth noting have made their way through the courts, both of which resulted in Iowa’s resi- dency restriction law being upheld. In State v. Seering (Iowa 2005), the Iowa Supreme Court overturned a lower court’s ruling that Iowa’s 2,000-foot resi- dency restriction was unconstitutional. The Iowa Supreme Court concluded that the infringement on sex offenders’ freedom of residency was superseded by the state’s compelling interest in protecting its citizens. In a separate but related case, the 8th U.S. Circuit Court of Appeals upheld the constitutionality of Iowa’s residency restriction law in a class action suit against the state by sex offenders (Doe v. Miller, 2005), saying the restrictions were “narrowly
3 Although the Colorado (2004) study used mapping software to produce maps that displayed the proximal relationships between sex offenders and schools and sex offenders and childcare centers, the software was not used to generate “exact measurements of resi- dences’ proximity to schools and childcare centers.” Rather, findings from the Colorado study were based on “an illustration of the sex offender residences…and their proximity to schools and childcare centers,” which showed no apparent relationship (p. 30).
4 • Justice Research and Policy
tailored to serve a compelling interest” – public safety. The ruling marked the first time that a federal appeals court heard a case involving sex offender resi- dency restrictions. While the ruling is binding only in the court’s seven-state Midwest region, it could be a persuasive precedent for other states to follow. The American Civil Liberties Union asked the U.S. Supreme Court to rule on the issue, but it declined to hear the case in November 2005. Due to its restric- tive nature, the Iowa law has generated so much controversy that the Iowa County Attorneys Association (ICAA) issued an official statement on February 14, 2006, that “the 2,000 feet residency restriction…does not provide the pro- tection that was originally intended and that the cost of enforcing the require- ment and the unintended effects on families of offenders warrant replacing the restriction with more effective protective measures” (ICAA, 2006).
One unintended outcome of residency restriction laws may be that they in- crease rather than decrease the likelihood of reoffending. Levenson and Cotter (2005b) recently conducted a survey of registered sex offenders in Florida and found that residency restrictions have forced them to move out of their homes and apartments, prevented them from living with supportive family members, and kept them from acquiring affordable housing. In other words, limits on housing options are forcing some sex offenders to become more isolated, fi- nancially and emotionally stressed, and less stable—all factors associated with recidivism (see Hanson & Harris, 1998). Despite these findings, the current trend in some areas is towards tightening sex offender residency restrictions.
To date, 16 states have adopted residency restrictions: Alabama, Arkan- sas, California, Florida, Georgia, Illinois, Indiana, Iowa, Kentucky, Louisiana, Michigan, Ohio, Oklahoma, Oregon, Tennessee and Texas. Restrictions vary with respect to the type of offender to which they apply (i.e., all sex offend- ers or only those under active supervision), as well as the type of location for which they apply and the size of the buffer or restrictive zone. For example, Iowa currently has a 2,000-foot buffer zone restriction, which is the largest among all 16 states with residency restriction laws. The restricted areas include “property comprising a public or non-public elementary or secondary school or a childcare facility.” Alabama uses a 1,000-foot buffer around a “property on which any school or child care facility is located,” with schools defined as public, private, or church schools providing instruction in grades K-12. California uses a 1,000-foot buffer around schools and parks, while Illinois uses a 500-foot buffer around “schools, playgrounds, and facilities providing programs or services exclusively directed toward persons less than 18 years of age.” Finally, in the state of Florida, sex offenders are prohibited from liv- ing within 1,000 feet of schools, daycares, parks, playgrounds, bus stops, and “other places where children regularly congregate.”
A bill filed recently in the Florida House of Representatives would have increased the residency restriction that the state imposes on sex offenders from a buffer distance of 1,000 feet to 2,500 feet (Florida House Bill 91CS, 2006).
Housing Options for Sex Offenders • 5
Although the bill failed to pass, other states (e.g., California and Texas) are considering similar buffer-distance increases, and hundreds of local jurisdic- tions, including approximately 40 in Florida, have already passed ordinances that increase the restricted zone, often to 2,500 feet.4 Despite Levenson and Cotter’s (2005b) findings that suggest limiting housing options may lead to an increase in reoffending among sex offenders, the extent to which housing op- tions are reduced by these policies is unclear and warrants investigation.
The current study employs Geographic Information Systems (GIS) to quantify the impact of a 1,000- and 2,500-foot residency restriction zone on the housing choices of registered sexual offenders. The hypothesis is that these residency restrictions severely limit the possibility for sexual offenders to establish residence in urban residential areas and that the allowable ar- eas in which they are able to reside will mostly consist of low-density rural/ agricultural areas. The current investigation uses Orange County, Florida, as a case study. The study area contains a range of different population densities and zoning categories, including high density, urban residential areas as well as low density, rural residential areas. Before findings are presented, the data and methods used are discussed.
* Data and Methods
The methodology employed in this study relies on using the parcel database of Orange County, Florida, to identify locations of all the “places where children congregate,”5 as well as locations of all residential properties that fall inside 1,000- and 2,500-foot buffer zones around these restricted areas. Analysis is conducted using ArcGIS software (ESRI, 2005). The following sections contain an overview of the data layers used in the GIS analysis, followed by a description of the analytic methods employed.
4 This study employs buffer distances of 1,000 and 2,500 feet. Even though the bill to increase the distance to 2,500 feet did not pass in the Florida House of Representa- tives, the distance of 2,500 feet is in effect in many local jurisdictions in Florida and is being considered by other states.
5 Florida’s Criminal Procedure and Corrections code states that if certain crime vic- tims are under the age of 18, then the courts must impose upon the convicted offender a prohibition on living within 1,000 feet of a school, daycare center, park, playground, bus stop, or other “places where children regularly congregate.” In the original statute, only schools, daycare facilities, parks, and playgrounds were specifically mentioned; but in 2004, public school bus stops were added to the law. Restrictions only apply to those convicted after October 1, 1997.

6 • Justice Research and Policy
Parcels
The 2004 parcel database for Orange County was obtained from the Or- ange County Property Appraisers Office. This database contains the boundaries of all legal properties, and includes information on the physical address of the property, the owner(s), tax assessment information, and zoning. The database was obtained in a GIS-compatible format; the original data were mapped at a scale of approximately 1:2,000, which means that the positional accuracy of the boundaries can be considered very reliable.
Attractions
A list of attractions of interest to children was obtained from Orange County. Addresses for the 22 records were exported to a DBF file and parcel geocoded6 using the Orange County parcel database. All 22 records were ac- curately matched and found to correspond to 22 unique properties in the parcel database. In addition, due to the unique nature of Orange County, all of the properties owned and operated by the Disney Corporation were identified in the parcel database and added to the set of attractions. The Disney Corporation runs a large number of different attractions, which were not captured sufficiently in the list of attractions for the entire county. The amount of land owned by Disney is quite large and makes the situation in Orange County a bit different. It should be noted, however, that most of these properties are not near residential areas, and therefore do not influence the analysis of residency restrictions very strongly.
Bus Stops
Locations of all public school bus stops in 2004 were obtained from the Or- ange County School Board. Individual datasets for elementary schools, middle schools, high schools, and special education schools were combined into a single dataset of 17,613 unique locations. The School Board made these data available in a GIS-compatible geocoded format.
Daycare Facilities
Locations of Florida daycare facilities in 2003 were obtained from the Florida Department of Children and Families. A subset of data was created for those facilities located in Orange County. Several daycare facilities were found to operate under multiple names at the same physical address; duplicate records were removed. This resulted in a total of 612 daycare facility records. Addresses for the 612 facilities were exported to a DBF file and parcel geocoded using the
6 Parcel geocoding is the process of assigning geographic coordinates to the data based on the county parcel information so that the records can be mapped.
Housing Options for Sex Offenders • 7
Orange County parcel database. A total of 498 records were accurately matched (81%). These 498 daycares are located on 498 unique parcels
Parks
A list of parks was obtained from Orange County. Addresses for the 265 re- cords were exported to a DBF file and parcel geocoded using the Orange County parcel database. A total of 252 records were accurately matched (95%). Of the unmatched records, 6 were boat ramps or fishing piers. The 252 individual parks are located on 237 unique parcels.
Schools
The location of public and private schools in Florida in 2004 was ob- tained from Florida’s Department of Education. A subset was created for those schools located in Orange County. Schools identified as adult education, such as vocational/technical schools, community colleges, and universities, were excluded, as well as those schools that were identified as inactive. In addition, several private schools were found to operate under multiple names at the same physical address; duplicate records were removed. This process resulted in a total of 309 schools. Addresses for the 309 records were exported to a DBF file and parcel geocoded using the Orange County 2004 parcel database. A total of 261 records were accurately matched (84%), including all public schools. These 261 schools are located on 254 unique parcels, since several of the school sites include multiple schools—for example, an elementary and middle school on the same property.
Zoning Information
The Orange County parcel database contains a specific zoning category for each parcel; these categories, however, vary with each jurisdiction since each incorporated area within the county has its own zoning code. Therefore, detailed zoning codes were obtained from Orange County and all incorpo- rated areas: Apopka, Bay Lake, Belle Isle, Eatonville, Edgewood, Lake Buena Vista, Maitland, Oakland, Ococee, Orlando, Windermere, Winter Garden and Winter Park. Zoning codes were used to determine the exact meaning and allowable uses of each zoning category. On the basis of this interpretation, generalized zoning categories for all of Orange County were created. Table 1 lists all of the zoning categories in Orange County, including whether residen- tial use is allowed and what unit density is allowed. Three general classes were created: 1) residential—these areas are exclusively residential; 2) combined use—these areas contain a combination of residential and other uses, typically commercial; and 3) nonresidential—these areas contain all other categories where no residential use is allowed. For the purpose of this analysis, both residential and combined use categories are considered; for the combined use categories it is not possible to determine which portion is residential, since in
8 • Justice Research and Policy
* Table 1
Zoning Categories in Orange County, Florida
|
Zoning Category |
Residential Allowed |
Single/Multi-Unit |
Unit Density (No./Acre) |
|
|
|
|
|
|
|
|
|
|
|
|
|
|
|
|
|
|
|
|
|
|
|
Residential Categories |
|
|
|
|
|
|
|
|
Rural/agricultural |
|
Yes |
Single |
< 0.1 |
|
|
|
Rural settlement |
|
Yes |
Single |
0.2 – 2 |
|
|
|
Low density residential |
|
Yes |
Single/multi |
2 – 10 |
|
|
|
Medium density residential |
Yes |
Single/multi |
10 |
– 20 |
|
|
|
High density residential |
|
Yes |
Multi |
20 |
– 75 |
|
|
|
Residential (general) |
|
Yes |
Not specified |
Not specified |
|
|
|
|
|
|
|
|
|
|
|
|
Combined Use Categories |
|
|
|
|
|
|
|
|
Planned development |
|
Yes |
Single/multi |
Variable |
|
|
|
Mixed use |
|
Yes |
Multi |
10 |
– 75 |
|
|
|
Urban activity |
|
Yes |
Multi |
20 |
– 100 |
|
|
|
Professional office |
|
Limited |
Multi |
10 |
– 75 |
|
|
|
|
|
|
|
|
|
|
|
|
Nonresidential Categories |
|
|
|
|
|
|
|
|
Commercial |
|
No |
- |
- |
|
|
|
|
|
|
|
|
|
Industrial |
|
No |
- |
- |
|
|
|
|
Public |
|
No |
- |
- |
|
|
|
|
Conservation |
|
No |
- |
- |
|
|
|
some cases multiple uses occur within the same parcel (e.g., commercial use on the ground floor and residential units on the 2nd and higher floors of a multi- story building).7
In addition to considering zoning, the presence of water features requires some attention. Parcels represent legal boundaries and include many areas where land occupation is not possible, including water features. Given the many surface water bodies in Orange County, a detailed data layer of surface water bodies was used to erase those parcels and portions of parcels covered by water features.
7 Including parcels which may not be exclusively residential introduces a potential overestimation of the number of properties available to establishing residence. However, apartment complexes and condominiums are located mostly on a single parcel; therefore individual units are not counted separately. This introduces a slight underestimation of the number of properties available to establishing residence. Reliable information on the number of apartment units on each parcel is not available, so the analysis is carried out at the parcel-level, not the unit-level. It should be noted that apartment complexes are mostly located in high density urban areas in close proximity to one or more restrictions. The lack of unit-level information in the analysis is therefore not expected to produce an underestimate of the number of properties available.
Housing Options for Sex Offenders • 9
Some parcels completely covered by water do not have a zoning category, but the parcel boundaries for many waterfront residential properties extend into surface water. An example of this is shown in Figure 1. In areas not currently developed, many parcels are quite large and may include large water features. The erase technique in ArcGIS corrects for this potential bias in determining the land area of parcels. In the analysis of distances to parcel boundaries, the original unmodified boundaries were used, but the area calculations by zoning category use the land area corrected for the presence of surface water bodies.
In addition to the zoning category and the presence of water features, a third consideration in the use of the parcel database is whether there are residential units present on the parcels. Many parcels are zoned for residential or combined use, but are not currently developed. Therefore, only those parcels where build- ings were present were selected. A combination of fields in the parcel database
* Figure 1
Parcel Boundaries Covering Water Features
10 • Justice Research and Policy
was used to accomplish this selection, including the year built, the square foot- age of the living area, and the assessed building value. When all three fields were blank and/or zero, the parcel was considered not to have any structure on it. The reliability of these three criteria was confirmed by comparing a sample of selected parcels with digital orthophotography from Orange County for 2004. A random sample of 200 residential and combined use parcels considered “oc- cupied” was selected and a determination was made of whether a structure was indeed present on the parcel; similarly, a random sample of 200 residential and combined use parcels considered “not occupied” was selected and a determina- tion was made of whether a structure was present. For the 200 occupied parcels, 194 were found to contain a residential structure, 1 was found to be vacant, and 5 were found to be under construction. For the 200 unoccupied parcels, 107 were found to be completely undeveloped, 15 were found to have a residential structure, 50 were found to be under construction and 28 were found to be non- residential (i.e., mostly consisting of right-of-way parcels within residential areas). Some of the discrepancies in the results can be attributed to the rapid urban de- velopment in Orange County, despite the fact that both the orthophotos and the parcels are from 2004. Of the total number of 314,692 residential parcels, ap- proximately 14.4% fall in the “unoccupied category”; these were excluded from the analysis, even though a small number of these may, in fact, have residential structures on them and many of them will be developed in the near future. The argument here is that it is not likely that the areas currently under development will have bus stops, daycares, schools, etc., located in their vicinity, but will in the near future as urban development continues. Including these areas would overestimate the properties with no residency restrictions.
Analysis of 1,000- and 2,500-Foot Restriction Zones
A total of five restrictions were used in the analysis: attractions, bus stops, daycares, parks, and schools. With the exception of bus stops, the locations of these restrictions are shown as polygons representing the legal boundaries of the properties.8 Buffer zones of 1,000 and 2,500 feet were created around each unique location; within each of the 5 restriction categories any overlapping buf- fers were dissolved, resulting in one single buffer zone for all locations within a single category combined. This approach is illustrated in Figure 2, which shows the 1,000- and 2,500-foot buffer zones around public school bus stops for a
8 Florida legislation explicitly describes how violations of residency restrictions are to be determined: “The 1,000-feet distance shall be measured in a straight line from the offender’s place of residence to the nearest boundary line (emphasis added) of the school, day care center, park, playground, or other place where children congregate. The distance may not be measured by a pedestrian route or automobile route” (Florida Statue §948.30[1b], 2005).
Housing Options for Sex Offenders • 11
sample study area. Where bus stops are in relatively close proximity to each other, the individual buffers are dissolved to form a single polygon. In effect, this makes it impossible to determine if a particular location is within 1,000 or 2,500 feet of a single bus stop or more than one bus stop. Since the number of bus stops within 1,000 or 2,500 feet is not relevant for determining residency restric- tions, dissolving the individual buffers for each individual restriction category is more meaningful than preserving the separate buffers. Total areas for each of these buffer zones were measured and tabulated and the results are presented in the next section.
The buffer zones of 1,000 and 2,500 feet for each of the five restrictions were compared with the parcel database to determine which occupied residen- tial properties fall within each of the restriction zones. A property was deter- mined to fall within a restricted zone if the boundary of the property is within
* Figure 2
Example of Overlapping 1,000- and 2,500-Foot Buffer Zones Around Bus Stops
Bus Stops
1,000-Foot Buffer Zones
2,500-Foot Buffer Zones
Parcel Boundaries
12 • Justice Research and Policy
1,000 or 2,500 feet of the boundary of the particular restriction. This approach most accurately represents the interpretation of the Florida statutes (see foot- note 4). For example, in Figure 3, a 1,000-foot buffer zone is created around the polygon representing the boundaries of the school property. Using GIS overlay analysis, all properties whose boundary falls completely or partially within this buffer zone are identified as being within 1,000 feet of the school boundary. This implies that a property can be identified as falling within the restricted zone even though some or most of the property does not fall within the buffer zone.
For each restriction category, and for all restriction categories combined, all properties falling within the 1,000- and 2,500-foot buffer zones were identified. Both the total number of properties and their combined land areas were deter- mined, as well as the percentage of the total occupied residential properties. Re- sults were tabulated by zoning category and are presented in the next section.
* Figure 3
Example of Parcels Located Within a 1,000-Foot Buffer Zone Around a School
1,000-Foot Buffer Zone
School Property
Parcels Within 1,000-Foot Buffer Zone
Parcels Outside 1,000-Foot Buffer Zone
Housing Options for Sex Offenders • 13
* Results
Zoning in Orange County
Table 2 provides a summary of the zoning categories in Orange County, both in terms of the number of parcels and the total area they occupy. The most dominant category in terms of numbers is low density residential (44.5%), fol- lowed by planned development (25.3%), medium density residential (10.0%) and rural/agricultural (5.8%). In terms of total area, rural/agricultural is by far the most dominant category (48.1%) due to the very large and mostly undevel- oped properties in this category. When considering only those parcels that are residential or combined use and are occupied, the occupation rates of the urban residential categories is very high (93.1% for low density, 91.6% for medium density and 86.3% for high density), a bit lower for the combined use categories (80.7% for mixed use, 80.7% for planned development, 80.7% for professional office and 67.4% for urban activity), and lowest for the rural residential catego- ries (75.1% for rural settlement and 46.2% for rural/agricultural).
Of the 332,859 parcels in Orange County 94.5% are zoned for residential or mixed use. Of those, 85.6% are considered occupied. These properties repre- sent the theoretical number of properties available for establishing residence.
* Table 2
Number and Area of Parcels by Zoning Category in Orange County, Florida
|
|
|
All Properties |
|
|
Percentage Occupied |
|
|
|
|
|
|
|
|
Zoning Category |
Number |
(%) |
Area (acres) |
(%) |
|
By Number |
By Area |
|
|
|
|
|
|
|
|
|
|
|
|
|
|
|
|
|
|
|
|
|
|
|
|
|
|
|
Residential and combined use |
|
|
|
|
|
|
|
|
|
|
High density residential |
15,728 |
4.7% |
11,519 |
2.2% |
86.28% |
78.4% |
|
|
|
Low density residential |
148,224 |
44.5 |
57,643 |
10.8 |
|
93.06 |
76.9 |
|
|
|
Medium density residential |
33,205 |
10.0 |
9,766 |
1.8 |
|
91.57 |
70.9 |
|
|
|
Mixed use |
1,168 |
0.4 |
4,523 |
0.6 |
|
80.74 |
25.3 |
|
|
|
Planned development |
84,092 |
25.3 |
99,971 |
18.7 |
|
80.69 |
48.5 |
|
|
|
Professional office |
2,278 |
0.7 |
2,486 |
0.5 |
|
80.68 |
67.3 |
|
|
|
Residential |
657 |
0.2 |
331 |
0.1 |
|
88.13 |
88.0 |
|
|
|
Rural/agricultural |
19,155 |
5.8 |
256,880 |
48.1 |
|
46.18 |
30.4 |
|
|
|
Rural settlement |
7,544 |
2.3 |
17,562 |
3.3 |
|
75.13 |
50.9 |
|
|
|
Urban activity |
2,641 |
0.8 |
15,449 |
2.9 |
|
67.40 |
87.9 |
|
|
|
|
|
|
|
|
|
|
|
|
|
|
Sum |
314,692 |
94.5% |
476,129 |
89.1% |
85.62% |
44.6% |
|
|
|
|
|
|
|
|
|
|
|
|
|
|
Nonresidential |
|
|
|
|
|
|
|
|
|
|
Commercial |
7,059 |
2.1 |
10,852 |
2.0 |
|
- |
- |
|
|
|
Conservation |
99 |
0.0 |
1,138 |
0.2 |
|
- |
- |
|
|
|
Industrial |
4,346 |
1.3 |
19,261 |
3.6 |
|
- |
- |
|
|
|
Public |
447 |
0.1 |
2,347 |
0.4 |
|
- |
- |
|
|
|
Unspecified |
6,216 |
1.9 |
24,898 |
4.7 |
|
- |
- |
|
|
|
|
|
|
|
|
|
|
|
|
|
|
Sum |
18,167 |
5.5% |
58,496 |
10.9% |
- |
- |
|
|
|
|
|
|
|
|
|
|
|
|
|
|
|
|
|
|
|
|
|
|
|
|
|
Total |
332,859 |
100% |
534,625 |
100% |
- |
- |
|
|
|
|
|
14 • Justice Research and Policy
Characteristics of Restriction Zones
Each of the five restrictions (attractions, bus stops, daycares, parks, and schools) was characterized in terms of the number of locations and the total land area of the 1,000- and 2,500-foot buffer zones around them. Table 3 shows the summary descriptive statistics.
The most dominant restriction in terms of both the number of locations and the areas of the buffer zones are the bus stops. The 17,613 bus stops result in buf- fer zones that are several times larger than any of the other categories. Daycares, schools and parks are roughly similar in terms of their 1,000- and 2,500-foot buf- fer zones. There are quite a few more daycares than parks or schools, but they are usually located on smaller properties, resulting in a roughly similar sized buffer zone. The attractions are the least dominant restriction; their number is very small (22) but they still comprise a relatively large area, in part due to size of the prop- erties of the Disney Corporation. In other study areas, the relative importance of attractions in terms of size would normally be expected to be much smaller.
When comparing the differences in the 1,000- and 2,500-foot buffer zones, an interesting pattern emerges. The buffer zones for daycares, parks, and schools approximately triple in size, which corresponds closely to the expected effect of multiplying the buffer zone by a factor of 2.5 and accounting for some increased degree of overlap from buffers around properties in close proximity. However, the increase around bus stops is only about 70%. This reflects the fact that bus stops in many areas are located very close together––so close in fact that many
* Table 3
Descriptive Statistics of Restriction Categories
|
Number |
Area of 1,000-Foot |
Area of 2,500-Foot |
Restriction Type |
of Locations |
Restricted Zone (Acres)a |
Restricted Zone (Acres)a |
Attractions |
22 |
24,545 |
35,934 |
Bus stops |
17,613 |
200,152 |
339,259 |
Daycares |
498 |
32,656 |
105,542 |
Parks |
237 |
39,350 |
99,908 |
Schools |
254 |
35,713 |
110,355 |
Combined |
18,624 |
245,085 |
379,336 |
a The 1,000- and 2,500-foot buffer zones are determined as one polygon for each of the restriction types. Thus, the restricted zone area is not the sum of the individual buffers around all individual locations, but the area within 1,000 or 2,500 feet from one or more locations of the same type. The combined number of locations is simply the sum of the individual locations. The combined area is determined as one polygon (i.e., the restricted zone is determined as the area within 1,000 or 2,500 feet from one or more locations of any type) created by merging the individual polygons for each restriction type. This approach prevents any double-counting of areas.
Housing Options for Sex Offenders • 15
of the 1,000-foot buffers of adjacent bus stops already overlap. A much larger buffer results in an increased degree of overlap, and therefore only a moderate increase in the total area.
Properties Within Restricted Zones
The 1,000- and 2,500-foot buffer zones for all restrictions were compared to all potentially available properties for establishing residence, defined as all oc- cupied residential and combined use parcels. Both the number of properties and their total combined area were determined as a percentage of all potentially avail- able properties. This analysis was carried out for each individual restriction as well as for all five restrictions combined. Separate analyses were completed for the 1,000- and 2,500-foot buffer zones. Results were tabulated by zoning category as well as for all zoning categories combined. Summary results are shown in Table 4.
When considering all restrictions combined, 95.2% of potentially available properties fall within 1,000 feet of one or more restricted areas and 99.7% fall within 2,500 feet. The only zoning categories with somewhat lower percentages are rural/agricultural (87.1% for 1,000 feet and 97.9% for 2,500 feet), rural settle- ment (86.5% and 98.6%) and urban activity (80.5% and 88.6%). The urban ac- tivity zoning category is very small (0.79 % of all potentially available properties) and mostly consist of commercial activity with some high-rise residential units. These results, therefore, lend strong support to the hypothesis that when consider- ing all the residency restrictions, housing choices for sexual offenders are very lim- ited, and what limited options remain mostly consist of rural/agricultural areas.
When considering the residency restriction categories individually, bus stops are the most restrictive (93.0% of potential properties fall within 1,000 feet of a bus stop and 99.6% within 2,500), followed by daycares (24.2% and 55.4%), schools (19.7% and 55.8%), parks (15.9% and 38.2%) and attractions (0.2% and 1.0%). These results clearly highlight the dominance of bus stops as a re- strictive factor, and show that daycares and schools result in roughly similar restrictions on the residency choices.
When considering the zoning categories, a very consistent pattern emerges across both buffer distances and across all five restriction categories: the percent- age of properties within a restricted zone is much higher for urban residential properties than for rural ones. For example, when considering the 1,000-foot buffer around schools, the percentage of properties within this zone for low, me- dium, and high density residential development are 22.5%, 29.9%, and 23.2%, respectively, while for rural/agricultural and rural settlement the percentages are 7.3% and 10.6%, respectively.
The impact of increasing the buffer zone distance from 1,000 to 2,500 feet is also illustrated by the results in Table 4. Given the highly restrictive nature of the bus stops, the results for all restrictions combined do not reflect a major difference: 95.2% versus 99.7%. However, differences for individual restriction categories are very substantial.
* Table 4
Characteristics of Occupied Residential Parcels Within Restricted Zones
|
|
|
|
|
|
|
|
Potentially Available Properties |
|
|
|
|
|
|
|
|
|
|
|
|
|
|
|
|
|
|
|
|
|
|
|
|
|
|
|
|
|
|
|
|
|
|
|
|
|
|
|
|
|
|
|
|
|
|
|
|
|
|
|
|
|
All Restrictions |
Attractions |
Bus Stops |
Daycares |
Parks |
Schools |
|
|
Zoning Category |
Number |
Parcels |
Area |
Parcels |
Area |
Parcels |
Area |
Parcels |
Area |
Parcels |
Area |
Parcels |
Area |
|
|
|
|
|
|
|
|
|
|
|
|
|
|
|
|
|
|
|
|
|
|
|
|
|
|
|
|
|
|
|
|
|
|
|
|
|
|
|
|
1,000 feet |
|
|
|
|
|
|
|
|
|
|
|
|
|
|
|
|
|
High density |
13,570 |
96.4% |
99.1% |
0.3% |
2.3% |
95.4% |
98.8% |
24.8% |
42.6% |
15.8% 18.4% |
23.2% |
27.1% |
|
|
residential |
|
|
|
|
|
|
|
|
|
|
|
|
|
|
|
|
|
Low density |
137,944 |
96.9 |
95.9 |
0.0 |
0.0 |
94.4 |
93.5 |
28.7 |
|
27.0 |
19.6 |
18.5 |
22.5 |
23.4 |
|
|
residential |
|
|
|
|
|
|
|
|
|
|
|
|
|
|
|
|
|
Medium density |
30,406 |
98.7 |
98.5 |
0.0 |
0.0 |
96.1 |
96.0 |
34.0 |
|
32.5 |
27.2 |
30.9 |
29.9 |
31.5 |
|
|
residential |
|
|
|
|
|
|
|
|
|
|
|
|
|
|
|
|
|
Mixed use |
943 |
99.5 |
93.0 |
0.0 |
0.0 |
85.0 |
89.3 |
23.9 |
|
17.4 |
58.7 |
20.7 |
36.9 |
17.5 |
|
|
Planned development |
67,855 |
92.2 |
90.2 |
0.3 |
7.0 |
91.1 |
85.0 |
14.0 |
|
8.8 |
3.6 |
39.2 |
9.8 |
42.0 |
|
|
Professional office |
1,838 |
97.2 |
94.6 |
0.0 |
2.6 |
89.1 |
89.0 |
40.0 |
|
33.6 |
43.9 |
44.4 |
46.7 |
35.6 |
|
|
Residential |
579 |
92.6 |
92.7 |
0.9 |
0.0 |
72.0 |
68.9 |
33.5 |
|
29.6 |
65.6 |
63.0 |
0.0 |
0.0 |
|
|
Rural/agricultural |
8,845 |
87.1 |
70.7 |
0.3 |
0.9 |
85.4 |
68.1 |
4.0 |
|
2.7 |
5.3 |
21.3 |
7.3 |
3.5 |
|
|
Rural settlement |
5,668 |
86.5 |
85.9 |
1.2 |
1.5 |
85.0 |
84.3 |
7.5 |
|
5.7 |
2.0 |
3.7 |
10.6 |
11.5 |
|
|
Urban activity |
1,780 |
80.5 |
93.0 |
10.5 |
6.1 |
67.1 |
89.9 |
27.5 |
|
9.4 |
35.7 |
9.2 |
42.9 |
77.7 |
|
|
|
|
|
|
|
|
|
|
|
|
|
|
|
|
|
|
|
|
Sum |
269,428 |
95.2 |
84.9 |
0.2 |
2.5 |
93.0 |
81.9 |
24.2 |
|
12.8 |
15.9 |
23.7 |
19.7 |
23.8 |
|
|
|
|
|
|
|
|
|
|
|
|
|
|
|
|
|
|
|
|
|
|
|
|
|
|
|
|
|
|
|
|
|
|
|
|
|
Policy and Research Justice • 16

|
|
|
|
|
|
|
|
Potentially Available Properties |
|
|
|
|
|
|
|
|
|
|
|
|
|
|
|
|
|
|
|
|
|
|
|
|
|
|
All Restrictions |
Attractions |
Bus |
Stops |
Daycares |
Parks |
|
Schools |
|
|
|
|
|
|
Zoning Category |
|
Number |
Parcels |
Area |
Parcels |
Area |
Parcels |
Area |
Parcels |
Area |
Parcels |
Area |
Parcels |
Area |
|
|
|
|
|
|
|
|
|
|
|
|
|
|
|
|
|
|
|
|
2,500 feet |
|
|
|
|
|
|
|
|
|
|
|
|
|
|
|
|
|
|
High density |
13,570 |
100.0% 100.0% |
0.8% 3.8% |
100.0%100.0% |
60.5% 73.1% |
42.6% 38.9% |
60.0% |
67.8% |
|
|
residential |
|
|
|
|
|
|
|
|
|
|
|
|
|
|
|
|
|
|
Low density |
137,944 |
100.0 |
100.0 |
0.3 |
0.3 |
|
100.0 |
100.0 |
62.9 |
58.8 |
46.5 |
43.0 |
63.7 |
59.7 |
|
|
residential |
|
|
|
|
|
|
|
|
|
|
|
|
|
|
|
|
|
|
Medium density |
30,406 |
100.0 |
100.0 |
0.2 |
0.2 |
|
100.0 |
100.0 |
71.0 |
70.7 |
55.7 |
60.9 |
73.4 |
73.8 |
|
|
residential |
|
|
|
|
|
|
|
|
|
|
|
|
|
|
|
|
|
|
Mixed use |
943 |
100.0 |
100.0 |
1.0 |
0.9 |
|
100.0 |
100.0 |
71.8 |
35.9 |
95.4 |
36.9 |
81.5 |
40.1 |
|
|
Planned development |
67,855 |
99.5 |
97.6 |
2.2 |
11.2 |
|
99.4 |
95.1 |
38.7 |
22.8 |
13.5 |
44.7 |
36.4 |
55.2 |
|
|
Professional office |
1,838 |
100.0 |
100.0 |
1.8 |
1.5 |
|
100.0 |
100.0 |
82.3 |
69.6 |
86.8 |
81.8 |
89.0 |
77.1 |
|
|
Residential |
579 |
100.0 |
100.0 |
0.0 |
0.0 |
|
96.4 |
95.9 |
80.1 |
76.3 |
95.5 |
92.9 |
7.9 |
11.2 |
|
|
Rural/agricultural |
8,845 |
97.9 |
79.0 |
0.5 |
0.9 |
|
97.4 |
77.0 |
17.2 |
6.3 |
19.1 |
25.8 |
19.4 |
7.0 |
|
|
Rural settlement |
5,668 |
98.6 |
96.6 |
2.3 |
2.8 |
|
98.5 |
96.5 |
20.0 |
16.9 |
13.4 |
19.1 |
36.2 |
29.3 |
|
|
Urban activity |
1,780 |
88.6 |
97.8 |
26.3 |
9.3 |
|
88.3 |
97.6 |
59.8 |
20.9 |
68.3 |
17.3 |
69.0 |
86.6 |
|
|
|
|
|
|
|
|
|
|
|
|
|
|
|
|
|
|
|
|
|
Sum |
269,428 |
99.7 |
91.4 |
1.0 |
3.9 |
|
99.6 |
90.1 |
55.4 |
28.1 |
38.2 |
35.2 |
55.8 |
40.5 |
|
|
|
|
|
|
|
|
|
|
|
|
|
|
|
|
|
|
|
|
• Offenders Sex for Options Housing
18 • Justice Research and Policy
The percentages represented in Table 4 do not necessarily convey housing choices very accurately from a market perspective, as they do not reflect the rela- tive availability of each zoning category. Therefore, it is meaningful to take the total number of parcels of each zoning category into consideration. Consider a specific example: the most dominant zoning category in Orange County is low- density residential, with 137,944 occupied properties, or 51.2% of all 269,428 occupied residential and combined use properties. Of these 137,944 potentially available properties in this zoning category, 22.5% fall within a 1,000-foot buffer around schools and 63.7% fall within a 2,500-foot buffer, reducing the number of available properties to 106,888 and 50,108, respectively. When considering all five restrictions combined, the number drops to 4,233 properties for the 1,000- foot buffer zones and to 37 properties for the 2,500-foot buffer zones. In addition, these numbers represent all existing properties and only a very small portion of these are likely to be available for rent or purchase at any particular point in time.
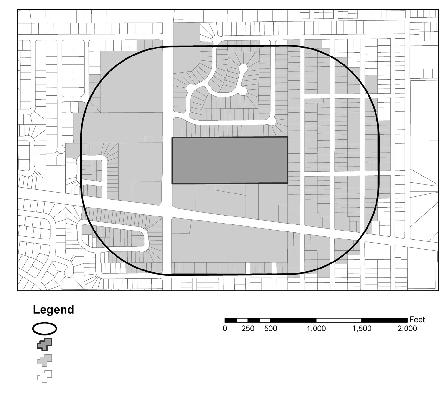
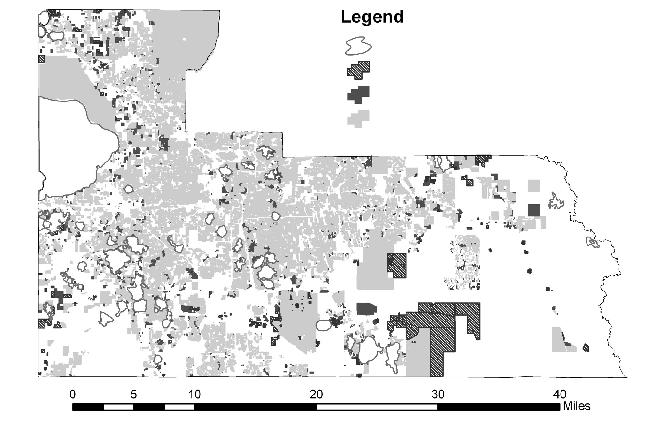
Overall, the results of the analysis of residency restrictions in Table 4 strongly suggest that the housing opportunities outside the 1,000- and 2,500-foot zones are severely limited. To better visualize this result, Figure 4 shows the extent of all potentially available residential properties, and those which fall outside of the 1,000- and 2,500-foot buffer zones. The pattern in Figure 4 suggests that the properties outside of the restrictions consist of small, isolated clusters at the urban/rural fringe.
* Conclusions
Results from the current case study of Orange County, Florida, provide strong evidence that housing options for sex offenders within urban residential areas are severely limited. Most housing options for convicted sex offenders are limited to low density rural areas. Moreover, the various restrictive categories examined (i.e., attractions, bus stops, daycare facilities, schools, and parks) vary greatly in terms of how they affect housing options.
Public school bus stops are by far the most restrictive category, followed by daycares, schools, parks, and attractions. The dominance of bus stops is to be expected, given their total number and dispersed nature. Bus stops are such a dominant restriction that very few additional properties are restricted as a result of incorporating the other restrictive categories in the analyses. The dominance of bus stops as a restrictive factor has not previously received a lot of atten- tion, in part because it has not been as widely used a restriction as schools and daycares. Instead, much of the debate regarding residency restrictions has been around the size of the buffer zone.
Increasing the buffer zone from 1,000 to 2,500 feet has a very minor impact in terms of housing options since so few properties (~4% of potentially available properties) fall outside the 1,000-foot buffer zone around bus stops. However,
* Figure 4
Occupied Residential Parcels in Orange County, Florida
Surface Water Features
Parcels Outside 2,500-Foot Zone
Parcels Outside 1,000-Foot Zone
All Occupied Residential Parcels
• Offenders Sex for Options Housing

20 • Justice Research and Policy
when only schools and daycares are considered, the 1,000-foot buffer still leaves approximately 64% of potentially available properties unrestricted; but when the buffer size is increased to 2,500 feet, only about 29% are left. The remaining housing options are also mostly limited to low-density rural areas. This research clearly demonstrates that while the size of the buffer zone is of importance, of greater influence is the definition of “places where children congregate.” The current research reveals that the choice of specific restriction categories has a major influence on the housing options outside of the restricted zones.
Restriction categories vary greatly in their number and spatial distribu- tion, resulting in very different restriction zones. This study also shows that a 1,000-foot buffer around public school bus stops currently in effect in Florida is much more restrictive than a 2,000-foot buffer zone around schools and child care facilities (currently in place in Iowa), making the residency restriction in Florida the toughest in the nation in terms of the size of the restricted zones and the reduction in housing opportunities. The debate regarding residency restric- tions, therefore, needs to consider the specific restriction categories being used and their definitions. In addition to the specific restriction categories used in this research and referred to in Florida statutes, many states (including Florida) have a reference to “places where children congregate.” If broadly interpreted, this category most likely would further reduce or eliminate whatever limited housing options remain.
To reiterate, limiting housing options for convicted sex offenders may lead to unintended consequences (Levenson & Cotter, 2005b). Isolation, financial and emotional hardships, and a decrease in stability have been linked to recidi- vism (Hanson & Harris, 1998). Limiting housing options for sex offenders to a few locations in low-density rural areas may produce such outcomes. For ex- ample, residency restriction laws may force sex offender to live in areas that limit their access to treatment. Studies show that sex offenders’ participation in and completion of treatment programs (e.g., cognitive behavior, cognitive skills, or relapse prevention) reduces recidivism (Alexander, 1999; Barbaree, Seto, & Mar- ic, 1996; Marques, Day, Nelson, & West, 1994; Marshall & Barbaree, 1988; Marshall, Eccles, & Barbaree, 1991; Rice, Quinsey, & Harris, 1991; Robinson, 1996). If sex offenders are forced to live in areas that afford them little access to treatment facilities and programs, successful reentry may not be realized.
The current study does not address the efficacy of residency restriction laws for crime prevention. As a result, the value of boundary restrictions to prevent new crimes by known offenders remains unknown. Regardless, the process of leaving prison and returning to society is complex and challenging.9 In 2001, the number of prisoners returning to the community was estimated to be about 1,600 on average each day (Bureau of Justice Statistics, 2006). If sex offender
9 For more information on prisoner reentry, see Travis, Solomon, & Waul (2001).
Housing Options for Sex Offenders • 21
residency restriction laws are so restrictive that successful reentry is not likely to be achieved, all components of the criminal justice system (e.g., enforcement, prosecution, and corrections) will feel the burden. Future research should there- fore examine more closely the effect of sex offender residency restrictions on subsequent recidivism.
Finally, this study demonstrates the utility of GIS in providing a detailed description of the housing options for sexual offenders under various residency restriction scenarios. GIS can also be used to describe several other factors that may play a role in recidivism, such as the proximity of sexual offenders to other measures of socioeconomic isolation. The GIS-based methodology presented in this paper (using zoning categories at the parcel level and proximity to commu- nity features of interest) provides a possible analytic framework within which the effects of various scenarios for residency restrictions could be evaluated. For example, Washington State recently passed a bill (Senate Bill 6325, 2006) requiring the development of statewide standards for cities and towns for use when determining whether to impose residency restrictions on sexual offenders. The bill provides the elements to consider when developing these guidelines, including: a) identification of areas in which sex offenders cannot reside, as well as areas in which they can reside; b) reasonable availability of housing units to accommodate registered sex offenders; c) response time of emergency services; and d) proximity to medical care, mental health care providers, and sex offender treatment providers. It appears the development of such guidelines might go a long way toward allowing for a proper consideration of housing op- tions for sexual offenders, which can be effectively and efficiently assessed using a GIS-based approach.
Findings from this study suggest that housing options for sexual offenders in a typical metropolitan area are very limited even under some of the least re- strictive scenarios. At present, 16 states have adopted residency restrictions and more are likely to follow. While our knowledge of mobility and displacement of sexual offenders is limited, the logical result of increasing residency restrictions is the displacement of sexual offenders to areas with few or no restrictions. More widespread adoption and enforcement of residency restrictions is also likely to result in larger numbers of sexual offenders being homeless and transient. The broader question as to whether these trends are desirable has not received suf- ficient attention, making it imperative that the unintended consequences of residency restrictions are understood––in particular, the link between recidivism and residency restrictions. Future research should also consider the effect of residency restrictions on the displacement of sexual offenders on multiple scales, including their movement between states.
22 • Justice Research and Policy
* References
Alexander, M.A. (1999). Sexual offender treatment efficacy revisited. Sexual Abuse: A Journal of Research and Treatment, 11(2), 101–117.
Association for the Treatment of Sexual Abusers. (2005). Facts about adult sex offenders.Beaverton,Oregon:Author.Retrievedfromhttp://www.atsa.com/ pdfs/ppOffenderFacts.pdf.
Barbaree, H. E., Seto, M. T., & Maric, A. (1996). Effective sex offender treat- ment: The Warkworth Sexual Behavior Clinic. Forum on Corrections Re- search, 8(3), 13–15.
Blair, M. (2004). Wisconsin’s sex offender registration and notification laws: Has the Wisconsin Legislature left the criminals and constitution behind?
Marquette Law Review, 87(5), 939–980.
Bureau of Justice Statistics. (2006). Reentry trends in the United States. Wash- ington, DC: U.S. Department of Justice, Office of Justice Programs. Re- trieved from http://www.ojp.usdoj.gov/bjs/reentry/reentry.htm.
Colorado Department of Public Safety. (2004). Report on safety issues raised by living arrangements for and location of sex offenders in the commu- nity. Denver, CO: Sex Offender Management Board. Retrieved from http: //dcj.state.co.us/odvsom/Sex_Offender/SO_Pdfs/FullSLAFinal01.pdf.
Edwards,W., & Hensley, C. (2001). Contextualizing sex offender management legislation and policy: Evaluating the problem of latent consequences in community notification laws. International Journal of Offender Therapy and Comparative Criminology, 45(1), 83–101.
Elbogen, E. B., Patry, M., & Scalora, M. J. (2003). The impact of community notification laws on sex offender treatment attitudes. International Journal of Law and Psychiatry, 26, 207–219.
ESRI (2005). ArcGIS Desktop Release 9.1, ESRI, Redlands, CA.
Hanson, R. K., & Harris, A. J. R. (1998). Dynamicpredictorsofsexualrecidivism. Ottawa, Canada: Department of the Solicitor General of Canada. Retrieved from http://ww2.psepc-sppcc.gc.ca/publications/corrections/199801 b_e.pdf.
Iowa County Attorneys Association. (2006). Statement on sex offender residency restrictions in Iowa. Retrieved from http://www.iowa-icaa.com/ ICA%20STATEMENTS/ Sex%Offender%20Residency%20Statement%2 0Feb%2014%2006%20for%20website.pdf
Levenson, J. S., & Cotter, L. (2005a). The impact of Megan’s Law on sex of- fender reintegration. Journal of Contemporary Criminal Justice, 21(1), 49–66.
Levenson, J. S., & Cotter, L. P. (2005b). The impact of sex offender residence restrictions: 1,000 feet from danger or one step from absurd? Interna- tional Journal of Offender Therapy and Comparative Criminology, 49(2), 168–178.
Housing Options for Sex Offenders • 23
Marques, J., Day, D., Nelson, C., & West, M. (1994). Effects of cognitive-be- havioral treatment on sex offender recidivism. Criminal Justice and Behav- ior, 21(1), 28–34.
Marshall, W., & Barbaree, H. (1988). The long-term evaluation of a behavioral treatment program for child molesters. Behavior Research and Therapy, 26(6), 499–511.
Marshall, W., Eccles, A., & Barbaree, H. (1991). The treatment of exhibition- ists: A focus on sexual deviance versus cognitive and relationship features.
Behavior Research and Therapy, 29(2), 129–135.
Minnesota Department of Corrections. (2003). Level three sex offenders resi- dential placement issues. St. Paul. MN. Retrieved from http://www.corr. state.mn.us/publications/legislativereports/pdf/2004/Lvl%203%20SEX% 20OFFENDERS%20report%202003%20(revised%202-04).pdf.
Mustaine, E. E., Tewksbury, R, & Stengel, K. M. (2006a). Residential location and mobility of registered sex offenders. American Journal of Criminal Jus- tice 30(2), 177–192.
Mustaine, E. E., Tewksbury,R , & Stengel, K. M. (2006b). Social disorganiza- tion and residential locations of registered sex offenders: Is this a collateral consequence? Deviant Behavior 27(3), 329–350.
Rice, M., Quinsey, V., & Harris, G. (1991). Sexual recidivism among child mo- lesters released from a maximum security psychiatric institution. Journal of Counseling and Clinical Psychology, 29(3), 381–386.
Robinson, D. (1996). Factors influencing the effectiveness of cognitive skills training. Forum on Corrections Research, 8(3), 6–9.
Schram, D., & Milloy, C. D. (1995). Community notification: A study of of- fender characteristics and recidivism. Olympia, WA: Washington Institute for Public Policy.
Tewksbury, R. (2004). Experiences and attitudes of registered female sex of- fenders. Federal Probation, 68(3), 30–33.
Tewksbury, R. (2005). Collateral consequences of sex offender registration.
Journal of Contemporary Criminal Justice, 21(1), 67–81.
Tewksbury, R., & Lees, M. (2006). Consequences of sex offender registration: Collateral consequences and community experiences. Sociological Spec- trum, 26(3), 309–334.
Tewksbury, R., & Mustaine, E. E. (2006). Where to find sex offenders: An ex- amination of residential locations and neighborhood conditions. Criminal Justice Studies, 19(1), 61–75.
Travis, J., Solomon, A. L., & Waul, M. (2001). From prison to home: The dimensions and consequences of prisoner reentry. Washington, DC: The Urban Institute. Retrieved from http://www.urban.org/UploadedPDF/from_ prison_to_home.pdf.
24 • Justice Research and Policy
Walker, J. T., Golden, J.W., & VanHouten, A. C. (2001). The geographic link between sex offenders and potential victims: A routine activities approach.
Justice Research and Policy, 3(2), 15–33.
Welchans, S. (2005). Megan’s Law: Evaluations of sexual offender registries.
Criminal Justice Policy Review, 16(2), 123–140.
Wright, R. G. (2003). Sex offender registration and notification: Public at- tention, political emphasis, and fear. Criminology & Public Policy, 3(1), 97–104.
Younglove, J. A., & Vitello, C. J. (2003). Community notification provisions of “Megan’s Law” from a therapeutic jurisprudence perspective: A case study.
American Journal of Forensic Psychology, 21(1), 25–38.
Zevitz, R. G., Crim, D., & Farkas, M. A. (2000). Sex offender community noti- fication: Examining the importance of neighborhood meetings. Behavioral Sciences and the Law, 18, 393–408.
Zevitz, R. G., & Farkas, M. A. (2000). Sex offender community notification: Managing high risk criminals or exacting further vengeance? Behavioral Sciences and the Law, 18, 375–391.
* Legislation and Cases
Adam Walsh Child Protection and Safety Act. Legislative Notice. U.S. Senate Republican Policy Committee (2006).
Doe. v. Miller, 405 F.3d 700, 710 (8th Cir. 2005).
Florida House Bill 91 CS. Residence of sexual offenders and predators. (2006). Florida Statute §947.1405(7a)(2). Conditional release program. (2005). Florida Statute §948.30(1b). Additional terms and conditions of probation or
community control for certain sex offenses. (2005).
Iowa Code §692A.2A. Residency restrictions—child care facilities and schools. (2003).
Jacob Wetterling Crimes Against Children and Sexually Violent Offender Reg- istration Act, 42 U.S.C. §14071 (1994).
Megan’s Law, Pub. L. No. 104–145, § 2, 110 Stat. 1345 (1996). Prosecutorial Remedies and Other Tools to End the Exploitation of Children Today (PROTECT) Act, Pub. L. 108–21, § 362, 117 Stat. 665 (2003). State v. Seering, 701 N.W.2d 655 (Iowa 2005).
Township of Manalapan, NJ: Chapter §187-1. Residency prohibition. Ord. No. 2005-29 (2005).
Washington Senate Bill 6325. Sex offenders – Residency requirements. (2005).